Research Article | | Peer-Reviewed

Ecological Footprint Assessment for Environmental Sustainability at the University of Juba, South Sudan

Received: 12 November 2024     Accepted: 27 November 2024     Published: 13 December 2024
Views:       Downloads:
Abstract

Given the growing population of students and the new infrastructural development at the University of Juba, it is environmentally significant to investigate the ecological footprint of the University campus ecosystem in light of environmental sustainability. This study aims to assess and quantify the ecological footprint at University of Juba campus and compare them to the environmental sustainability. In this study cross sectional survey of 180 students and component based methods by Rees and Wackernagel were employed to obtain results of ecological footprint of water, food, land, transport, waste and energy at the University of Juba. Considering Ecological Footprint of students and staff on campus, Biocapacity was 1.16, ecological footprint remainder was 1.06 and ecological footprint index was 0.92. While the ecological footprint of Water, food, transportation, waste, energy and built-up land footprint were 0.04, 0.03, 0.03, 0.01, 0.0003 and 0.0002 gha/capita respectively. The result of the environmental sustainability practices on the campus revealed that 11 out of 44 environmental sustainable programs were not practiced on campus implying 27.7% of the university operation was unsustainable. However, University of Juba was found to be environmentally sustainable, reducing its ecological footprint per capita by 0.89 gha/capita. Based on the study result, the Ecological Footprint per capita of water, energy, transportation, food, waste and build-up land at the University were environmentally sustainable (0.11 gha/capita). That means if, all people were living the lifestyle of the University of Juba, we would require only one planet Earth.

Published in American Journal of Environmental Protection (Volume 13, Issue 6)
DOI 10.11648/j.ajep.20241306.16
Page(s) 219-233
Creative Commons

This is an Open Access article, distributed under the terms of the Creative Commons Attribution 4.0 International License (http://creativecommons.org/licenses/by/4.0/), which permits unrestricted use, distribution and reproduction in any medium or format, provided the original work is properly cited.

Copyright

Copyright © The Author(s), 2024. Published by Science Publishing Group

Keywords

Ecological Footprint, Environmental Sustainability, University of Juba, Biocapacity, Ecological Footprint Index

1. Introduction
The word Ecological Footprint (EF) was conceptualized by Wackernagel and Rees and defined as a tool used to assess environmental sustainability and effects that a society has on its environment . Whereas Environmental Sustainability is the use of environment that meets the needs of the present generation without compromising the environment of the future generation . Ecological footprint compares human demand with Earth's ecological capacity to regenerate resources and provide services .
EF represents the amount of biologically productive land and sea area needed: (a) to regenerate the resources a human population consumes and (b) to absorb the corresponding waste and render it harmless. The concept of EF is based on the principle that land is a fundamental factor on which all societies depend, since it provides living space, products and services, and a sink for wastes. Productive land is, therefore, a proxy for the demands societies place on the environment .
EF has often been regarded as a reliable indicator of anthropogenic pressure on the environment since it does not ignore tradeoffs among different types of environmental exploitation . It can be used as an indicator of sustainability. It is used to estimate how much of the Earth or how many planet Earths it would take to support humanity if everybody lived a given lifestyle . In 2017, World average EF per person was 2.7 global hectare (gha) per capita. Meanwhile, due to covid-19, in 2019 and in 2021 global EF reduced to 1.5 gha. As compared to continents; North America has EF of 8.04 gha, Australia 7.1 gha, Europe 4.7 gha, South America 2.6 gha, Asia 2.6 gha and Africa has 1.2 gha per capita .
In 2022, Global Footprint Network (GFN) calculated EF of countries including Qatar =14.7 gha, USA= 8.04 gha, Australia= 7.2gha, UK= 4.2 gha, China= 3.71 gha, Libya= 3.4 gha, Sudan= 1.33 gha, Uganda= 1.04 gha, DRC = 0.01 gha. If everybody on the earth lived like the lifestyle of USA, we would require 8.04 earths to sustain our life. In Africa the highest EF in 2022 is Libya with 3.4 gha . However no assessment of South Sudan EF has been investigated.
So many EF analyses have been carried out by students at different universities in some countries around the world to calculate the impact students and staff place on their campus ecosystem and formulate ways to reduce their ecological footprint hence promoting environmental sustainability . It also helped students to broaden their experiences in environmental sustainability to be used in their respective societies . In 2013 San Jose State University had EF of 4.46 gha, Polito University had 0.19 gha 2021, Leuven University had 0.35 gha .
However, the ecological footprint of University of Juba has never been studied. Given the growing population of students and the new infrastructural development at the University of Juba, it was therefore environmentally significant to investigate the ecological footprint on the University campus ecosystem in light of environmental sustainability.
The objective of this study was to assess, and quantify ecological footprint of water, energy, food, transportation, land, and waste in light of sustainability at the university of Juba campus.
This study measured and quantified the EF at the university of Juba using primary and secondary data to obtain information about the components (food, waste, energy, transportation, land and water) and compared them with Biocapacity, which is the maximum allowed resource consumption rate and waste discharge that can be sustained indefinitely in a given region without gradually impairing the functional integrity and productivity of the relevant ecosystem per capita in regards to sustainability.
2. Materials and Methods
University of Juba (UoJ) is a public university located in Juba city, South Sudan which is located at a latitude 4°50'28"N, longitude 31°35'24" E and 487.07 meters above sea level. It is the largest university in the country. University of Juba campus has a total area of 569,945 square meters (101 hectares). The estimated population of students and staff was 38,000 and 2,000 respectively . The University buildings are spread on two campuses main and custom campus, with male and female hostels in the center of the two campuses. The main campus has open spaces for football and basketball at Eastern part of the campus as well as many parking areas which are scattered on the campus. The Main Administration Complex, office spaces, library, halls, laboratories, restaurants, University clinic, University power house, University waste store, and mechanical workshop are concentrated on the main campus. The University landscape comprised of trees including Neem (Azadirachta indica), Mahogany (Swietenia mahoni), Mango (Mangifera indica) and some ornamental plants. Custom campus comprised of mostly large halls, library, physics laboratory and scattered ornamental plants. New construction activities were taking place at the campus.
In this study, both qualitative and quantitative research method for collection of both primary and secondary data were used. Qualitative study design was used for collection of secondary data that involved review of related literature in books, reports, journals, and magazines in libraries and online. Questionnaires were also used to collect primary data from various respondents on campus. Face to face interviews, observations among others were used to determine ecological footprint at the University of Juba, main and custom campus. The data collection covered a period of one year coinciding with the first and second semesters when students and staff were full time on campus.
To assess and determine ecological footprint status of students and staff at University of Juba main and custom campus, empirical survey was carried out to determine the different components, that is, food consumption, water consumption, housing, energy and waste generation footprint in the study area. Questionnaires were distributed to each school with respect to the amount of daily food consumption, water consumption, transportation, energy consumption and waste generation. The average values obtained from these questionnaires were then converted to EF. A sample size of 180 was selected from the study population using Yamane, 1967 formula (n = N/1+N*(e) 2). During the survey, 180 respondents answered the questions.
To measure and quantify the ecological footprint of water, energy, food, transportation, built-up land and waste in light of sustainability at the University of Juba, component approach of ecological footprint assessment was used. The six components, including energy (kWh), water (m3), food consumption (ton), waste production (ton), built-up land (ha) and transportation (tCO2/km), were analyzed in the period of one academic year 2023. The ecological footprint should be equal to the Biocapacity available per person which is 1.0 or less to be sustainable .
2.1. Energy Consumption
For energy consumption category, the study considered the use of electricity at University of Juba (UoJ) for several activities, among them are: lighting, air conditioning, computers and other appliances for teaching and research. The data of energy, including electricity consumption, were attained from the power management unit at UoJ. To realize the accuracy of the calculation, the investigator also extracted detailed data from the monthly bills and daily bills of the local meter at the building level.
2.2. Water Usage
The data of the water usage was obtained from the directorate of engineering office, water management unit and assessed the number of water tankers on the campus. The water at the University of Juba is used for drinking, irrigation and sanitation purpose. The main sources of the water was underground water and surface water from river Nile transported by water tankers.
2.3. Food Usage
The quantity of food usage at the UoJ campus were provided by the restaurants and cafeterias. Interviews were done to obtain data from the University restaurants for period of one academic year. Food variables were divided into the following: meat, vegetables, processed and unprocessed foods. And also gardens on both campuses growing subsistent maize, beans, okra, tomatoes, groundnuts onions and cattle both for consumption and scientific research were quantified and analyzed.
2.4. Waste Production
The waste production data was obtained via interviews with university waste management officials, observation and questionnaires to all campus users. Since waste is collected daily at the University, the researcher estimated the amount of the waste in tons. The recorded reports of the waste management unit service office was applied in the estimations. The stores on the campus was used as field to study the types of wastes on the campus.
2.5. Transportation
The EF of transport linked to the walk trips and the University commuting of students, staffs and administrative staff were quantified using questionnaires, some data from transport unit and observation count of transport means entering the campuses in the morning from 7:00 - 9:00 PM, afternoon from 12:00 - 2:00 PM and evening from 5:00 - 7:00 PM on Monday, Tuesday and Friday every two weeks per month of January, February March, April, May, June, July, August, September, October, November and December.
2.6. Built-up Land
The built-up land footprint was calculated using GIS based on the area of land covered by human infrastructure, transportation, housing and other structures.
The land areas covered with buildings, water, trees, free areas, garbage areas and the land coverage of the University of Juba was determine using geographical information system (GIS).
The data of energy (kWh), water (m3), food consumption (ton), waste production (ton), built-up land (ha) and transportation (tCO2/km), were analyzed in the period of one academic year 2022 - 2023 and calculated according to in Table 1 and Figure 1.
2.6.1. Metric Conversions Factors to Calculate Several Components of the Ecological Footprint of UoJ
Table 1. Shows the conversion of units in this study.

UNIT

CONVERSION

1gram =

0.000001 ton

1kg =

0.001 ton

1ha =

1gha

1motorcycle emits =

119.6 CO2 g/km

1Car emits =

192 CO2 g/km

1 Bus emits =

171 CO2 g/km

1kg =

0.001 ton

1m2 =

0.01 ha

1kWh =

0.0036 Gigajoules

2.6.2. The Structure for the Calculation of Ecological Footprint and Biocapacity at the University of Juba
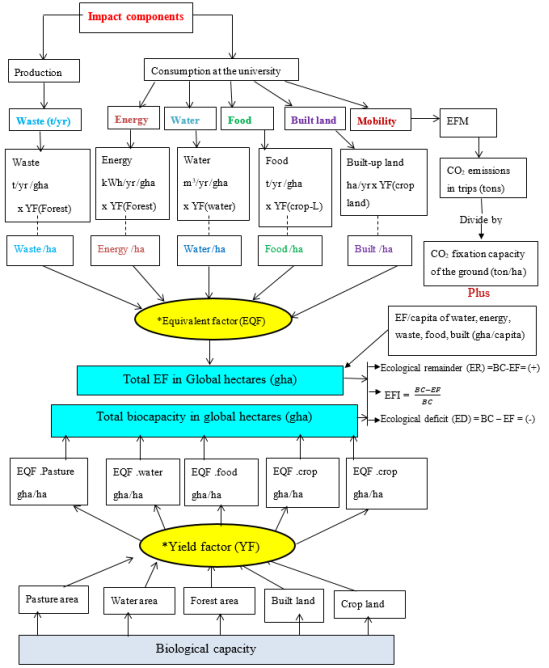
Figure 1. Flow chart for the calculation of ecological footprint.
3. Results and Discussions
3.1. Transportation on Campus
The most common means of transport on campus were bus, car, lorry, motorcycle, tricycle, bicycle and foot (walking) as depicted in Figure 2 below. Out of the several means of transport, bus constitutes 50% of the means of transport. This implies that majority of the respondents use bus to reach the campus making public transport such as buses significant in reducing the ecological footprint of a campus. They are more energy-efficient than personal vehicles and can reduce traffic congestion .
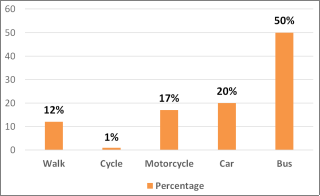
Figure 2. Shows means of transport used on campus.
3.2. Waste Production
The most common wastes found on campuses includes paper, plastic, electronics, leaves and food wastes. Figure 3, depicts that majority of the respondents (76%) accumulated less than 0.3kg of waste per day on campus while only 2% of the respondents accumulated 1.0-1.8kg per day per capita. This implies that waste footprint on campus is environmentally sustainable because most people produce only 0.3kg of waste per day/capita. High waste per day/person could lead to negative impact on the environment and the campus community. This would lead to water pollution, soil contamination, air pollution and health hazard when they were improperly disposed . The highest waste footprint was recorded in the month of April, May, June, September, October, and November has the highest footprint of (55.7 ton) when students and staff are fulltime on campus while the month of January, March, August and December has the low footprint recorded (31 ton) due to most students are on holidays. Whereas February has the least footprint of (28 ton) due to few number of working days in the month. It can lead to health risks for both humans and animals. Disease-carrying insects and vermin can spread diseases if they come into contact with waste . This can damage the University’s reputation and negatively impact its relationship with the local community.
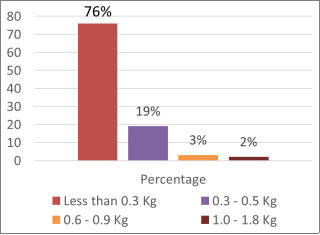
Figure 3. Shows waste accumulated per day per capita.
3.3. Water Usage
Results are shown in the Figure 4, indicates the much water used to be supplied during working days (80,000 L) and used to be used all in the same day whereas only (60,000 L) used to be supplied during weekends and could be used all. This implies that water footprint was not sustainable on campus because the water supplied per day was used all, this means there was high water demand to be supplied to satisfy the campus users’ needs. A high water usage can lead to water scarcity issues as emphasized by . This can affect the University’s ability to maintain its operations and can lead to conflicts with local communities, hence increased cost of water bills for the University.
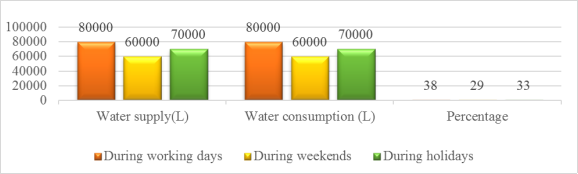
Figure 4. Shows water usage.
3.4. Food Consumption
The main categories of food on campus were meat, vegetables and mixed feeding. As shown in the figure 5, depicts that large proportion meat (18.1%), vegetables (9.9%) used to be cooked, compared to only (4.5%) of beans used to be cooked on campuses per day. This implies that food footprint was unsustainable on campus due to high cooked meat on campus which used to be consume all. This is in unison with , proposed that animal products such as meat has significant impact on the environment at the University campus this include climate change by emissions of greenhouse gases in production of animal, it requires large amount of water which can lead to water scarcity issues. Large amount of land which can lead to deforestation, habitat loss, and soil degradation. The disposal of animal products also generate waste including manure and packaging materials and animal dung, comports with emphasizes that, this wastes can contribute to air, and water pollution, negatively impacting the campus environment .
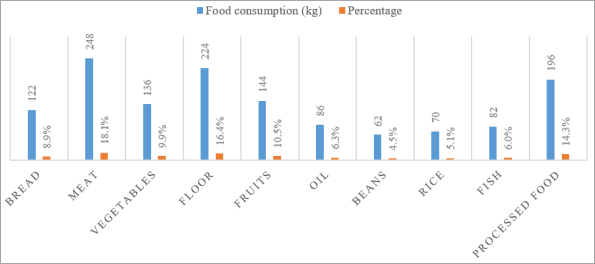
Figure 5. Shows food consumption per day.
3.5. Energy Consumption
The types of energy found on campuses were renewable from solar panels and none-renewable energy from national grid and backup generators. University of Juba Power Management Unit were the sole operator of electricity on the campuses. With high output of energy noted from nonrenewable energy. Figure 6, indicates that mega energy (50%) used to be recorded during working days from Mondays to Fridays while 25% energy was recorded every weekends and holidays. A high energy footprint per day on campus can lead to a larger ecological footprint for several reasons . Firstly, the energy came from non-renewable sources such as fossil-fuels, which contribute to greenhouse gas emissions and climate change . Secondly, energy consumption can lead to other forms of pollution, such as air pollution and noise pollution from generators. The combustion of fossil fuels releases large amount of greenhouse gases, such as methane, sulfur dioxide, nitrogen oxide and carbon oxide into the atmosphere which can lead to respiratory and other health issues , as well as causing climate change from the emission of greenhouse gases .
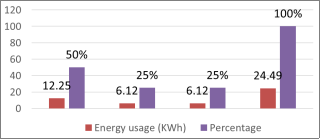
Figure 6. Shows energy consumption per day.
3.6. Build-up Land
Figure 7 below reveals that the total area of the University of Juba is 101 hectares. The build areas was 69.39 hectares while 31.61 hectares were empty spaces.
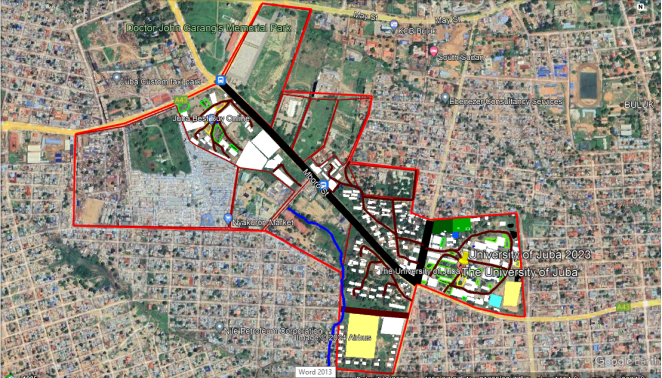
Figure 7. Shows the area of the University of Juba.
4. Biocapacity Calculation at the University of Juba
Biocapacity (BC) has a fundamental role in ecological sustainability. To calculate the BC for the UoJ campus, first, the necessary data such as cropland, grazing land, water area, forest land and built-up land were obtained from FAO . The BC for the state of Central Equatoria State (1,826,936.812) was calculated and then the BC per capita was determined (1.16). The state BC extrapolated for the UoJ campus was based its mean population. The BC per capita for Central Equatoria State was calculated and the results are presented in Table 2.
Table 2. Central Equatoria State per capita BC in 2023 .
Table 2. Shows the Central Equatoria State BC in 2023 by FAO.

Land type

Area (ha)

Equivalent Factor (EQF)

Annual Production (ton)

Yield Factor (YF)

Biocapacity (BC)

Crop land

654.9

2.49

353.646

0.54

880.578

Grazing land

1,261,740

0.46

1,261,740

1

580,400.4

Forest land

2,277,630

1.26

979,380.9

0.43

1,234,019.934

Water area

13,480

0.37

13,480

1

4,987.6

Built-up land

13,350

2.49

2,670

0.2

6,648.3

TOTAL

1,826,936.812

To find, annual production (tons) = YF*A(1)
Total BC of Central Equatoria State (CES) = 1,826,936.812
Population of CES = 1,574,700
The BC is assessed by multiplying the land area available annually for production of each product, by the appropriate yield and equivalence factors as shown in equation 3 . A region’s BC (gha) for any land type is calculated as follows;
BC (gha) = A. YF. EQF(2)
Where, A is the available area for a given land use type (ha), YF is the yield factor that is different for everywhere, and EQF is the equivalent factor . Where Biocapacity per area is calculated as;
Biocapacity per capita =Total biocapacity areaTotal population(3)
Therefore,
Biocapacity per capita (gha) =1,826,936,812 1,574,700 = 1.16
4.1. Yield Factor
Yield Factor (YF) =Annual production (ton) Area (ha)(4)
Yield factor is a factor that varies from everywhere. It is presented in the Table 3.
Table 3 Yield Factors specific to the South Sudan footprint accounts for 2023 .
Table 3. Shows yield factors of Biocapacity in South Sudan.

Area type

Yield Factor (World ha/ha)

Crop land

0.54

Forest land

0.43

Grazing land

1

Water area

1

Built-up land

0.2

4.2. Equivalent Factor
Due to the fact that most human settlement are located in a very fertile land areas of the world crop land and built area are equal in the amount of EQF .
The equivalent factor for various land type are presented in table 4 . Table 4 Equivalent factor used in the South Sudan footprint accounts for 2023 .
Table 4. Shows Equivalent Factors of BC in South Sudan.

Land type

Equivalent Factor (EQF)

Crop land

2.49

Grazing land

0.46

Forest land

1.26

Water area

0.37

Built-up land

2.49

5. Ecological Footprint Calculation at the University of Juba
There are many formulas used to calculate EF as given in the below equations.
Equation 5 for calculation of EF components .
Total EF (gha) =iCi. efiPi(5)
Total EF (gha) was determined through weighted sum of the total natural resources consumption components and waste production divided by land productivity (ha/ton/year). Where, Ci (amount /year) is the amount of the consumed resources or waste production in a year, efi (gha/ha) is a constant coefficients, and Pi (ha/ton/year) is the land productivity. In regard to the six components, including energy (Gigajoules), water (m3), food consumption (ton), waste production (ton), built-up land (ha) and transportation (tCO2/km), were analyzed in the period of one academic year 2023. The data of the following components were collected and analyzed as follow. Given the values of EF at the University of Juba in 2023 in the Table 5.
Table 5. Shows the analyses of Ecological Footprint Calculation at the University of Juba Campus.

EF Components

Total/day

Total/year (365days)

Hectares (ha)

Global hectares (gha)

Water (m3)

11.500

4,197.5

4197.5

1,553.075

Waste (tons)

2.34

854.1

367.263

462.751

Food (tons)

2.74

1,000.1

540.054

1,344.7446

Energy (GJ)

0.0666

24.309

10.452

13.16952

Built-up land (ha)

69.39

69.39

37.4706

93.301794

Mobility (tCO2/km)

55.6767

20,322

635.0625

800.17875

TOTAL

4,257.220664

5.1. Transport (Mobility) Footprint Calculation
First and foremost, the total emission corresponding to each respondent of the transport and observation count was calculated by considering the emission factor of the mode of transport utilized, which is the amount of CO2 (ton) that given mode of transport per kilometer travelled. In the case of car travel, the carbon footprint of a medium petrol car was 192 grams of CO2 per kilometer, a medium diesel bus carbon footprint was 171 grams of CO2 per Kilometer, and motorcycle emits 119.6 grams of CO2 per kilometer , while bicycle and on foot are non-emitting transport mode, had a factor of 0 . As presented in the Table 6.
Table 6. Shows transport (Mobility) Footprint Calculation.

Means of transport

Percentage

Users

tonCO2/year

Walk (on foot)

12%

4,800

0

Cycle (on bicycle)

1%

400

0

Motorcycle

17%

6,800

2,950.66

Car

20%

8,000

4,963.24

Bus

50%

20,000

12,408.1

TOTAL

100%

40,000

20,322

The equation below was used to calculate ecological footprint of transport .
Mobility =CO2 emissions in (tons)CO2 fixation capacity of the ground (tonha)(6)
In this component of mobility, the results obtained in 2023 survey and observation count are presented. UoJ students and staff performed 12,840,000 journeys in the year covering 125,960,600 km/year in total in 2023, amounting to a direct emission of 20,322 tons of CO2 in the atmosphere. EFM was 635.0625 ha of local forest land and 644.3892 gha, corresponding to 6 times the total area occupied by UoJ or 10 times its Biocapacity to absorb the gases (the forest land at the UoJ is 1.6 ha). The EFM equals 18.79% of the total EF of UoJ in 2023.
Table 7. Shows EFM and EFM per capita.

EFM Components

CO2 emissions (tCO2/year)

EFM (ha)

EFM (gha)

EFM gha/capita

UoJ Campus

20,322

635.0625

800.17875

0.02832

Total EF/Area = Total Ecological Footprint (gha)Area (ha)(7)
Solution
Total EF/Area =4,257.220664101= 42.150 gha
EF per Capita=Total EF (gha)Population(8)
Solution
EF per Capita=4,257.22066440,000= 0.106 ≈ 0.11 gha/capita
Breakdown of Ecological Footprint Components Using Equation 8
i) Water footprint = 1,553.07340,000 = 0.0388 gha/capita
ii) Waste footprint = 462.75140,000 = 0.011568 gha/capita
iii) Food footprint = 41344.744640,000 = 0.0336 gha/capita
iv) Energy footprint = 13.1695240,000 = 0.000329 gha/capita
v) Built-up land = 93.301740,000 = 0.000233 gha/capita
Vi) Transportation footprint = 800.1787540,000 = 0.02832 gha/capita.
5.2. Ecological Deficit and Ecological Remainder
The Ecological Deficit (ED) indicates that the ecological resilience capacity is sufficient, whereas the Ecological Remainder (ER) indicates that the ecological capacity is surplus, i.e., more than the resource consumption and the amount of waste neutralization .
ED is when EF is bigger than BC
ER is when EF is smaller than BC.
BC and EF are used to determine whether a region is located in an ecological remainder or ecological deficit. They are calculated as follow in equation 9 and 10 .
ER = BC – EF = (+)(9)
ED = BC – EF = (-)(10)
ER - ED = BC – EF {(ER > 0 =sustainable, ED < 0 = unsustainable)}
ER and ED depicts the given states with footprints bigger and smaller than their Biocapacity, respectively. To show how much they are sustainable.
Therefore, from the equation;
ER and ED = BC – EF, where BC = 0.16 and EF = 0.11 gha/capita.
Solution, ER and ED = 1.16 – 0.11 = 1.05 ER.
The Ecological Remainder = 1.05 meaning sustainable, Biocapacity is bigger than the EF.
5.3. The Ecological Footprint Index
The EFI is the percentage difference between the ecological resilience capacity (BC) and the ecological footprint (EF) and shows the level of sustainability of a given region. From the equation (11) of EFI. The interpretation of EFI and its relationship with the sustainability level are presented in Table 9 .
EFI = BC-EFBC(11)
Where BC = 1.16, and EF = 0.11
Solution, EFI = 1.16-0.091.16, = 1.061.16 = 0.91
Therefore, EFI = 0.92
5.4. Environmental Sustainability Practices at the University of Juba Campus
1. Building construction and renovation based on green design principles i.e. (relying on clean energy includes: solar, wind, hydroelectric, green roof, renovation),
2. Energy conservation practices (including turn off light, unplug devices and appliances not in use, skylight, walking, ventilation, window etc.),
3. Waste Reduction practices (such as e- communication, waste collection, double- sided copying, and waste free lunch program),
4. Recycling of solid waste (including paper, plastic metal, e- waste etc.),
5. Sustainable food program (such as local organic, or fair-trade food),
6. Water conservation practices (including efficient toilets, minimal irrigation, harvested rainwater etc.),
7. Sustainable landscaping (integrated pest management, native plants, trees in pots, porous pavers, compound grasses, biodiversity, minimizing lawn etc.),
8. Sustainable transportation program (including bicycle/pedestrian friendly system, carpool, bus pass programs, biodiesel programs),
9. Green purchasing from environmentally and socially responsible companies (products are non-toxic, water and energy conserving, etc.),
10. Reduction of toxic materials and radioactive waste , presented in Figures 8, 9, 10, 11, and 12.
Based on the above practices, remarks were given based on the present practices as; Total Remarks = 44, Present practices = 33, None present practices = 11, Total rate = 44 x 4 = 176.
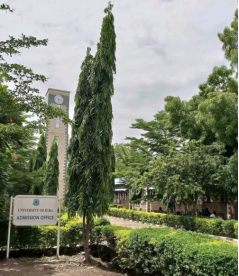
Figure 8. Shows sustainable landscaping.
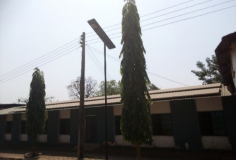
Figure 9. Shows energy conservation practices (solar panels).
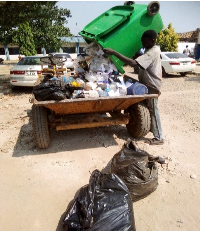
Figure 10. Shows waste reduction practices.
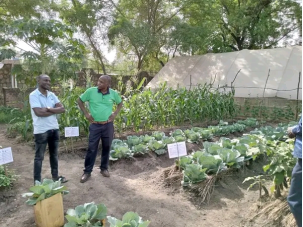
Figure 11. Shows sustainable food program.
Table 8. Shows the Analyses of the Environmental Sustainability Practices at the University of Juba Campus.

Rate

Code

Total

Remarks

Percentage

None

1

12

Unsustainable

27.27

A little

2

14

Slightly sustainable

31.81

Quite a bit

3

17

Moderately sustainable

38.63

Great deal

4

1

Greatly sustainable

2.27

TOTAL

76

44

4

100%

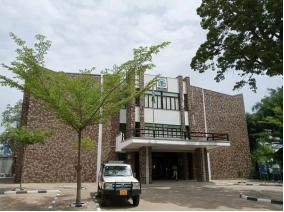
Figure 12. Showed building construction and renovation based on green design principles (LEED).
The Table 8, indicates that the campus was sustainable. 38.63% and 31.81% moderately and slightly sustainable respectively. Most of the environmental sustainable practices were available on campus such as energy conservation, water conservation, bus pass and carpool, local food, sustainable Land scape among others .
5.5. Comparing Ecological Footprint of Different Universities around the World to the EF of University of Juba
The Table 9, indicated that the highest ecological footprint per capita was recorded at the University of Kurdistan (1.69) in 2016 – 2021, while the least ecological footprint per capita was recorded at the University of Juba in 2023. The lower ecological footprint result at the University of Juba was due to low consumption when compared to high consumption in developed countries. Most studies have found strong correlations between living standards at lower consumption levels (developing countries), and decoupling at higher levels (industrialized countries) .
Table 9. Shows comparison of Ecological Footprint of different universities around the world to the EF of University of Juba.

University

Kurdistan

Tianjin

Leuven

East Anglia

Newcastle

Redland

Juba

Country

Iran

China

Belgium

UK

Australia

USA

South Sudan

Reference

Vaisi

Liuet al.

Lambrechts

Wright et al.

Flint

Venetoulis

Morris

Year

2016 – 2021

2014 – 2015

2010 - 2011

2007 - 2008

1998 - 1999

1998 - 1999

2022 – 2023

Study period

Four academic years

One academic year

One academic year

One academic year

One academic year

One academic year

One academic year

Population

9,982

30,000

7,611

18,000

19,200

2,727

40,000

Area (ha)

101

200

2.22

129.5

135

57

101

Total EF/ (gha)

16,484

4659

2663.7

----

3,592

2,300

4,199.85

Total EF/ Area

163.21

23.3

1200

102

27

40

41.58

EF per capita

1.69

0.16

0.35

0.73

0.19

0.84

0.11

Energy (%)

70.73

7.8

17.83

28.96

----

50.26

0.3

Food (%)

1.28

48.28

4.77

----

5.97

---

31.58

Mobility (%)

----

----

44.22

10.28

42.66

32.57

18.79

Built-up (%)

----

----

----

1.01

43.73

----

2.19

Waste (%)

26.87

16.56

0.05

59.5

----

12.5

10.86

Water (%)

1.12

27.37

0.01

0.25

----

4.67

36.48

Goods & Services (%)

----

----

23.69

-----

3.97

----

---

Infrastructure (%)

-----

-----

9.43

-----

3.67

----

---

Components with highest impact (%)

Energy

Food

Mobility

Waste

Built-up land

Energy

Water

-70.73

-48.28

-44.22

-59.5

-43.73

-50.26

-36.48

EFI

-0.82

0.61

----

----

----

----

0.92

Environmental Sustainability

Unsustainable

Very Sustainable

Very Sustainable

Sustainable

Very Sustainable

Sustainable

Very Sustainable

The study therefore, brings to light the status of the ecological footprint of the University of Juba and it adds to the existing body of knowledge. The anticipated limitations includes lack of knowledge about the term ecological footprint by the respondents and unwillingness of respondents to share information in the process of data collection, bad weather conditions especially high temperature up to 34°C and heavy rainfall, distance and transport complication to the research site, lack of personal computer and inability to include indirect consumption of components of ecological footprint of students in their homes due to lack of funds. However, further studies is needed in transportation footprint, energy footprint and food footprint at the University of Juba while including their indirect consumption of the components from homes. Moreover, this studies need to be carried out in the counties, states, South Sudan as a nation and other higher institutions and organizations in South Sudan.
6. Conclusions
This study aimed to assess and quantify the ecological footprint of water, waste, transportation, food, energy and build-up land at University of Juba campus and compare them to the environmental sustainability. Based on the study result, the Ecological Footprint per capita footprint of Water, food, transportation, waste, energy and built-up land footprint were 0.04, 0.03, 0.03, 0.01, 0.0003 and 0.0002 gha/capita respectively which were environmentally sustainable (0.11 gha/capita). If, all people were living the lifestyle of the University of Juba, we would require only one planet Earth. Therefore, it’s recommended that University of Juba maintains and improves on its ecological footprint status to enhance its environmental sustainable goals. More emphasis should be put on reducing water, food and transportation footprint and maintaining the other components. To improve and maintain ecological footprint at University of Juba in regards to sustainability, this study recommended the University of Juba administration to establish University Environmental Sustainability Office (ESO). Recommending environmental coordinator to continuously audit the environment and encourage behavior change at the University of Juba.
Abbreviations

EF

Ecological Footprint

GFN

Global Footprint Network

ESO

Environmental Sustainability Office

gha

Global Hectare

UoJ

University of Juba

EFI

Ecological Footprint Index

BC

Biological Capacity

ha

Hectares

GIS

Geographical Information System

USA

United States of America

UK

United Kingdom

DRC

Democratic Republic of Congo

CES

Central Equatoria State

LEED

Leadership in Engineering and Environmental Design

ER

Ecological Footprint Remainder

ED

Ecological Footprint Deficit

FAO

Food and Agriculture Organization

EFM

Ecological Footprint of Mobility

YF

Yield Factor

EQF

Equivalent Factor

kWh

Kilowatt Hours

Kg

Kilogram

A

Area

t

Ton

m2

Meter Square

m3

Meter Cube

Km

Kilometer

CO2

Carbon Dioxide

GJ

Gigajoule

Acknowledgments
The authors would like to acknowledge University of Juba administration for supporting the project financially and offering moral motivations. Thanks to College of Natural Resources and Environmental Studies, Department of Environmental Studies and wildlife for their enormous support and willingness to take part in the study.
Authors Contributions
David Nasir Morris: Conceptualization, Data curation, Formal Analysis, Investigation, Methodology, Project administration, Resources, Visualization, Writing – original draft
Malik Doka Morjan: Conceptualization, Supervision, Writing – review & editing
Moses Osman Mathew Woni: Data curation, Software
Charles Manya: Supervision, Validation, Writing – review & editing
John Apuruot Akec: Conceptualization, Resources, Supervision
Conflicts of Interest
The authors declare no conflicts of interest.
References
[1] Rees, W. E. Ecological footprints and appropriated carrying capacity: What urban economics leaves out. Environ. Urban. 1992, 4, 121–130.
[2] Morelli, John (2011) "Environmental Sustainability: A Definition for Environmental Professionals," Journal of Environmental Sustainability: Vol. 1: Iss. 1, Article 2.
[3] Ewing, B.; Moore, D.; Goldfinger, S.; Oursler, A.; Reed, A.; Wackernagel, M. The Ecological Footprint Atlas 2010; Global Footprint Network: Oakland, CA, USA, 2010.
[4] Galli, A.; Wiedmann, T.; Ercin, E.; Knoblauch, D.; Ewing, B.; Giljum, S. Integrating Ecological, Carbon and Water footprint into a “Footprint Family” of indicators: Definition and role in tracking human pressure on the planet. Ecol. Indic. 2012, 16, 100–112.
[5] Torregrosa-López, J. I.; Bellver-Navarro, C. G.; Lo Iacono-Ferreira, V. G. Experiences in the use of Ecological Footprint as a sustainability indicator. Cuad. de Biodivers. 2011.
[6] Ecological Footprint by Country 2022. Retrieved 13 June 2023. Available at
[7] Global Footprint Network. (2022). National Footprint and Biocapacity Accounts, 2022 edition.
[8] Blum, O.; Wackernagel, M. How to Build Lasting Success on Our Finite Planet; Global Footprint Network (GFN) and Schneider Electric, USA. 2020. Available online:
[9] Ortegon, K.; Acosta, P. Ecological footprint: A tool for environmental management in educational institutions. Sustain. High. Educ. 2019, 20, 675–690.
[10] Eckard Helmers; Chia Chien Chang; Justin Dauwels. (2021). Carbon footprinting of universities worldwide: Part I—objective comparison by standardized metrics.
[11] Collins, A.; Flynn, A. Engaging with the ecological footprint as a decision-making tool: Process and responses. Local Environ. 2007, 12, 295–312.
[12] Gottlieb, D.; Vigoda-Gadot, E.; Haim, A.; Kissinger, M. The ecological footprint as an educational tool for sustainability: A case study analysis in an Israeli public high school. Educ. Dev. 2012, 32, 193–200.
[13] Vaisi, S.; Alizadeh, H.; Lotfi, W.; Mohammadi, S. Developing the Ecological Footprint Assessment for a University Campus, the Component-Based Method. Sustainability 2021, 13, 9928.
[14] University of Juba – Inventing the Future Transforming the Society. Retrieved 19 September 2023. Available at
[15] Dnsamudre (26 August 2021). "South Sudan's Top 5 Universities in the 2022 - web insights". Worldtop-100. Retrieved 6 October 2022.
[16] Syrovátka, M. On sustainability interpretations of the Ecological Footprint. Ecol. Econ. 2020, 169, 106543.
[17] Janis, J. A. Quantifying the Ecological Footprint of the Ohio State University; Ohio State University: Columbus, OH, USA, 2007.
[18] Mathis Wackernagel, Chad Monfreda, Dan Moran, Paul Wermer, Steve Goldfinger, Diana Deumling, Michael Murray May 25, 2005. National Footprint and Biocapacity Accounts 2005: The underlying calculation method.
[19] Lenzen, M.; Murray, S. A. A modified ecological footprint method and its application to Australia. Ecol. Econ. 2001, 37, 229–255.
[20] IPCC (2006). IPCC guidelines for national greenhouse gas inventories. Prepared by the National Greenhouse Gas Inventories Programme. Eggleston H. S., Buendia L., Miwa K., Ngara T. and Tanabe K. (eds). Kanagawa, Japan, Institute for Global Environmental Strategies.
[21] Bovea, D. M; Valls-Val, K (2021) Carbon footprint in Higher Education Institutions: a literature review and prospects for future research.
[22] Venetoulis, J. (2001). Assessing the ecological impact of a university. The ecological footprint for the University of Redlands.,
[23] Mekonnen H, A. Y. Hoekstra, Four billion people facing severe water scarcity. Sci. Adv. 2, e1500323 (2016).
[24] Liu, H.; Wang, X.; Yang, J.; Zhou, X.; Liu, Y. The ecological footprint evaluation of low carbon campuses based on life cycle assessment: A case study of Tianjin, China. Clean. Prod. 2017, 144, 266–278.
[25] Yifan Gu. (2018). Environmental f ootprint assessment of green campus from a food-water-energy nexus prespective.
[26] Long Qian, Qingling Rao, Hongbo Liu, Breda McCarthy, Li Xian Liu & Lingen Wang (2022) Food waste and associated carbon footprint: evidence from Chinese universities, Ecosystem Health and Sustainability, 8:1, 2130094,
[27] GEMIS. (2020) Global emissions model for integrated systems. Free database,
[28] Klein-Banai, C.; Theis, T. L. An urban university’s ecological footprint and the effect of climate change. Ecol. Indic. 2011, 11, 857–860.
[29] Conway, T. M., Dalton, C., Loo, J. and Benakoun, L. (2008), "Developing ecological footprint scenarios on university campuses: A case study of the University of Toronto at Mississauga", International Journal of Sustainability in Higher Education, Vol. 9 No. 1, pp. 4-20.
[30] Global Temperature Rise. The Evidence for Rapid Climate Change. 2021. Available online:
[31] FAO. 2023. Land Cover Atlas of the Republic of South Sudan. Rome.
[32] Monfreda, C.; Wackernagel, M.; Deumling, D. Establishing national natural capital accounts based on detailed ecological footprint and biological capacity assessments. Land Use Policy 2004, 21, 231–246.
[33] National Footprint and Biocapacity Accounts (NFBA) 2023 Edition. Available on;
[34] Arsenault, J.; Talbot, J.; Boustani, L.; Gonzalès, R.; Manaugh, K. (2019) The environmental footprint of academic and student mobility in a large research-oriented university
[35] Sonetti, G; G. V. Fracastoro; P. Lombardi; C. Genta; S. Favaro. (2021) Quantitative assessment of environmental impacts at the urban scale: the ecological footprint of a university campus. Environment, Development and Sustainability
[36] Perez-Lopez, J.-B.; Orro, A.; Novales, M. Environmental Impact of Mobility in Higher-Education Institutions: The Case of the Ecological Footprint at the University of A Coruña (Spain). Sustainability 2021, 13, 6190.
[37] United Nations, Department of Economic and Social Affairs, Population Division. World Population Prospects: The 2017 Revision, Key Findings and Advance Tables. 2017. Available online:
[38] Lang, S. (2007). Environmental sustainability checklist to be used for projects submitted under EU regional funding.
[39] Poveda, C. A.; Lipsett, M. G. A review of sustainability assessment and sustainability/environmental rating systems and credit weighting tools. Sustain. Dev. 2011, 4, 36–55.
[40] Wackernagel, M.; Yount, J. D. The ecological footprint: An indicator of progress toward regional sustainability. Environ. Monit. Assess. 1998, 51, 511–529.
[41] Wackernagel, M.; Onisto, L.; Bello, P.; Linares, A. C.; Falfán, I. S. L.; García, J. M.; Guerrero, A. I. S.; Guerrero, M. G. S. National natural capital accounting with the ecological footprint concept. Ecol. Econ. 1999, 29, 375–390.
[42] Ferng, J.-J. Nested open systems: An important concept for applying ecological footprint analysis to sustainable development assessment. Ecol. Econ. 2014, 106, 105–111.
[43] Alizadeh, H. The Challenge of Sustainable Urban Development in Third World Countries. In Proceedings of the Designing Soundscape for Sustainable Urban Development, Stockholm, Sweden, 30 September–1 October 2010.
[44] Galli, A.; Kitzes, J; Wermer, P.; Wackernagel, M.; Niccolucci, V.; Tiezzi, E. (2007) An exploration of the mathematics behind the Ecological footprint.
[45] Hoekstra, A. Y. The Water Footprint of Modern Consumer Society, 2nd ed.; Routledge: London, UK, 2019.
Cite This Article
  • APA Style

    Morris, D. N., Morjan, M. D., Woni, M. O. M., Manya, C., Akec, J. A. (2024). Ecological Footprint Assessment for Environmental Sustainability at the University of Juba, South Sudan. American Journal of Environmental Protection, 13(6), 219-233. https://doi.org/10.11648/j.ajep.20241306.16

    Copy | Download

    ACS Style

    Morris, D. N.; Morjan, M. D.; Woni, M. O. M.; Manya, C.; Akec, J. A. Ecological Footprint Assessment for Environmental Sustainability at the University of Juba, South Sudan. Am. J. Environ. Prot. 2024, 13(6), 219-233. doi: 10.11648/j.ajep.20241306.16

    Copy | Download

    AMA Style

    Morris DN, Morjan MD, Woni MOM, Manya C, Akec JA. Ecological Footprint Assessment for Environmental Sustainability at the University of Juba, South Sudan. Am J Environ Prot. 2024;13(6):219-233. doi: 10.11648/j.ajep.20241306.16

    Copy | Download

  • @article{10.11648/j.ajep.20241306.16,
      author = {David Nasir Morris and Malik Doka Morjan and Moses Osman Mathew Woni and Charles Manya and John Apuruot Akec},
      title = {Ecological Footprint Assessment for Environmental Sustainability at the University of Juba, South Sudan
    },
      journal = {American Journal of Environmental Protection},
      volume = {13},
      number = {6},
      pages = {219-233},
      doi = {10.11648/j.ajep.20241306.16},
      url = {https://doi.org/10.11648/j.ajep.20241306.16},
      eprint = {https://article.sciencepublishinggroup.com/pdf/10.11648.j.ajep.20241306.16},
      abstract = {Given the growing population of students and the new infrastructural development at the University of Juba, it is environmentally significant to investigate the ecological footprint of the University campus ecosystem in light of environmental sustainability. This study aims to assess and quantify the ecological footprint at University of Juba campus and compare them to the environmental sustainability. In this study cross sectional survey of 180 students and component based methods by Rees and Wackernagel were employed to obtain results of ecological footprint of water, food, land, transport, waste and energy at the University of Juba. Considering Ecological Footprint of students and staff on campus, Biocapacity was 1.16, ecological footprint remainder was 1.06 and ecological footprint index was 0.92. While the ecological footprint of Water, food, transportation, waste, energy and built-up land footprint were 0.04, 0.03, 0.03, 0.01, 0.0003 and 0.0002 gha/capita respectively. The result of the environmental sustainability practices on the campus revealed that 11 out of 44 environmental sustainable programs were not practiced on campus implying 27.7% of the university operation was unsustainable. However, University of Juba was found to be environmentally sustainable, reducing its ecological footprint per capita by 0.89 gha/capita. Based on the study result, the Ecological Footprint per capita of water, energy, transportation, food, waste and build-up land at the University were environmentally sustainable (0.11 gha/capita). That means if, all people were living the lifestyle of the University of Juba, we would require only one planet Earth.
    },
     year = {2024}
    }
    

    Copy | Download

  • TY  - JOUR
    T1  - Ecological Footprint Assessment for Environmental Sustainability at the University of Juba, South Sudan
    
    AU  - David Nasir Morris
    AU  - Malik Doka Morjan
    AU  - Moses Osman Mathew Woni
    AU  - Charles Manya
    AU  - John Apuruot Akec
    Y1  - 2024/12/13
    PY  - 2024
    N1  - https://doi.org/10.11648/j.ajep.20241306.16
    DO  - 10.11648/j.ajep.20241306.16
    T2  - American Journal of Environmental Protection
    JF  - American Journal of Environmental Protection
    JO  - American Journal of Environmental Protection
    SP  - 219
    EP  - 233
    PB  - Science Publishing Group
    SN  - 2328-5699
    UR  - https://doi.org/10.11648/j.ajep.20241306.16
    AB  - Given the growing population of students and the new infrastructural development at the University of Juba, it is environmentally significant to investigate the ecological footprint of the University campus ecosystem in light of environmental sustainability. This study aims to assess and quantify the ecological footprint at University of Juba campus and compare them to the environmental sustainability. In this study cross sectional survey of 180 students and component based methods by Rees and Wackernagel were employed to obtain results of ecological footprint of water, food, land, transport, waste and energy at the University of Juba. Considering Ecological Footprint of students and staff on campus, Biocapacity was 1.16, ecological footprint remainder was 1.06 and ecological footprint index was 0.92. While the ecological footprint of Water, food, transportation, waste, energy and built-up land footprint were 0.04, 0.03, 0.03, 0.01, 0.0003 and 0.0002 gha/capita respectively. The result of the environmental sustainability practices on the campus revealed that 11 out of 44 environmental sustainable programs were not practiced on campus implying 27.7% of the university operation was unsustainable. However, University of Juba was found to be environmentally sustainable, reducing its ecological footprint per capita by 0.89 gha/capita. Based on the study result, the Ecological Footprint per capita of water, energy, transportation, food, waste and build-up land at the University were environmentally sustainable (0.11 gha/capita). That means if, all people were living the lifestyle of the University of Juba, we would require only one planet Earth.
    
    VL  - 13
    IS  - 6
    ER  - 

    Copy | Download

Author Information
  • Department of Environmental Studies, College of Natural Resources and Environmental Studies, University of Juba, Juba, South Sudan

    Biography: David Nasir Morris is a Researcher at the University of Juba, Environmental Studies Department. He completed his Bachelor Degree (Honors) in Environmental Studies from University of Juba in 2023. Recognized for his exceptional contributions. Mr. David Nasir has been honored with the Professional Teacher designation by the esteemed Eloi Secondary School. In addition, he holds a certificate of Education in Teaching in accordance with Ministry of Education and Instruction, Central Equatoria State SMOE/NS/01718. He has participated in multiple national research collaboration projects in recent years. He currently serves as Environmental Researcher on a private/individual bases.

  • Department of Wildlife Science, College of Natural Resources and Environmental Studies, University of Juba, Juba, South Sudan

  • Department of Environmental Studies, College of Natural Resources and Environmental Studies, University of Juba, Juba, South Sudan

  • Department of Environmental Studies, College of Natural Resources and Environmental Studies, University of Juba, Juba, South Sudan

  • Departmentment of Mechanical Engineering, College of Engineering, University of Juba, Juba, South Sudan

  • Abstract
  • Keywords
  • Document Sections

    1. 1. Introduction
    2. 2. Materials and Methods
    3. 3. Results and Discussions
    4. 4. Biocapacity Calculation at the University of Juba
    5. 5. Ecological Footprint Calculation at the University of Juba
    6. 6. Conclusions
    Show Full Outline
  • Abbreviations
  • Acknowledgments
  • Authors Contributions
  • Conflicts of Interest
  • References
  • Cite This Article
  • Author Information